Mapping our nation's bias

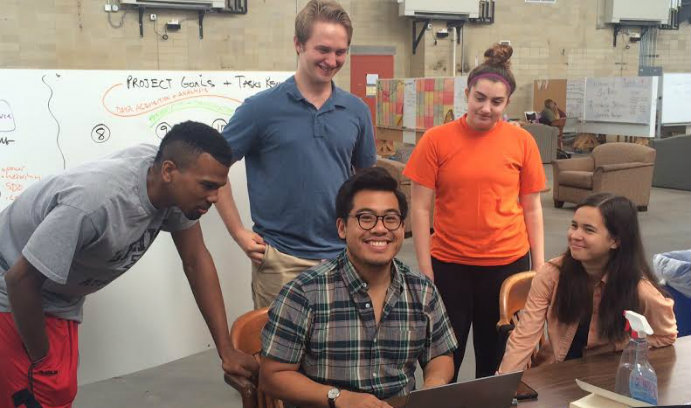
The Geography of Bias Mountaintop team examined the relationship between geographic location and racial bias. Clockwise from left: Devon Carter '16, Nathan Keim '17, Alexandra Pizzuto '17, Audra McComb '17 and graduate student Nick Ungson. Not pictured: Celia Fung '15 and mentor Dominic Packer. (Photo by Dominic Packer)
Recent deaths of African Americans at the hands of police officers and the killing of nine members of a historic black church in Charleston have brought the issue of race relations to center stage in the United States. This summer, a Mountaintop team examined how integration, social capital and implicit bias affect race relations in different regions of the United States.
“A lot of people, when they think about racial bias, they tend to think about people being explicitly racist, using racial slurs or something like that,” says Nathan Keim ’17, sitting at a table in Bay C-3 on Lehigh’s Mountaintop campus. “But that’s not the only form of racism.”
Mentored by Dominic Packer, associate professor of psychology, Keim and a team of students looked at a different, less obvious form of racism: implicit bias.
Implicit bias refers to unconscious and automatic negative attitudes that affect how we think, speak and act with regard to characteristics such as race or ethnicity. An individual might openly and emphatically claim to be unbiased. They might honestly believe that they hold egalitarian views. They still, however, may hold some sort of implicit bias. This type of bias is far more difficult to address, as it doesn’t always manifest in easily observable behaviors. Instead, implicit bias results in, for example, an employer’s tendency to avoid interviewing black job candidates or a judge's inclination to impose longer sentences on black defendants than white defendants convicted of the same crime—behaviors not as readily observed as the racial slurs or the enforcement of segregation that are so apparent with explicit bias.
The team began by reading literature about topics including implicit bias and urban inequality. After narrowing their focus to implicit bias, they decided to examine how the level of intergroup contact within a population affects its levels of implicit bias.
“If you look at the literature from political science and compare it with the literature of psychology, you’ll find that they say different things about whether contact is good,” says Nick Ungson, a third-year graduate student in psychology. “So [political science research literature claims that] being in contact with other racial groups might increase bias, and psychology literature says contact is good, it lets you know more about other people and can reduce bias. We’re looking at that on these broader scales.”
The Mountaintop team, which includes Keim, Ungson, Celia Fung ’15, Devon Carter ’16, Alexandra Pizzuto ’17 and Audra McComb ’17, discovered that both claims are valid—it just depends on the location and condition of the community in which a person lives.
Contact, social capital and bias
The group analyzed data from Project Implicit, a non-profit organization and collaborative research project focused on implicit bias. Project Implicit offers the Implicit Association Test (IAT), an educational tool intended to develop awareness of implicit bias. The IAT, which can be taken online, measures attitudes and beliefs that individuals may not be willing or able to report about themselves. The “social attitudes” version of the IAT asks users to look at words with positive and negative connotations along with pictures of black and white people. Users then pair words and pictures and the test measures the user’s response time. If two concepts are strongly associated, response time should be faster, revealing an intuitive evaluative response. If concepts are not as strongly associated, users should take longer to respond. So, for example, a user’s response time in pairing the word “good” and a photograph of a black man, combined with other responses, provides a measure of implicit bias. Project Implicit has created a “virtual laboratory” of sorts online, and its datasets are freely available for researchers.
The Mountaintop team examined a dataset that includes the results collected from over a million white IAT respondents across the United States between 2000 and 2009. They also examined data from other sources, including the Racial Residential Segregation Measurement Project, which is based on 2000 census data, the 2009 social capital index from the Northeast Regional Center for Rural Development, which measures proxies for civic engagement.
The group applied linear regression analyses to county-level data from states in specific regions of the US: the Northeast, the South, the Midwest and the West. If they noticed geographic patterns among the data, they created scatterplots and maps for each region, making the patterns easily recognizable.
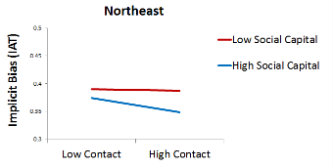
The team discovered among the Northeastern counties a statistically significant interaction between contact and social capital, which is defined by the Kennedy School of Government at Harvard University as “a wide variety of quite specific benefits that flow from the trust, reciprocity, information, and cooperation associated with social networks.” If an area in the Northeast has a high level of social capital, the team found, contact among groups reduces the level of implicit bias among whites.
“High contact [in the Northeast] seems to be associated with reduced bias, but only in counties with high social capital,” the team reported on its blog. “Conversely, there is no effect of interracial contact on bias in Northeastern counties with low social capital. In the Northeast, then, high social capital appears to provide an opportunity for positive interracial interactions in integrated communities, thus reducing implicit bias.”
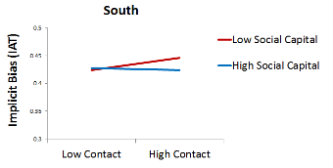
The data from counties in Southern states, on the other hand, followed a strikingly different pattern.
“Although there was again a statistically significant interaction between contact and social capital [in the South], there are crucial differences,” the team wrote. “Unlike in the North, interracial contact does not decrease bias in Southern counties with high social capital—there appears to be no effect. However, in Southern counties with low social capital, increased interracial contact actually increases implicit bias. Instead of acting as an opportunity for contact to reduce bias, high social capital seems to act as a buffer to the negative effects of interracial contact that appear in areas with lower social capital. When high social capital is present, contact doesn’t matter—however, when social capital is absent, high interracial contact may lead to more negative interactions between black and white citizens, possibly influencing increased implicit bias.”
The group reported that counties in Western states with social capital had lower levels of implicit bias and that interracial contact did not affect bias. Neither social capital nor intergroup contact appeared to affect implicit bias in the Midwest.
A unique approach
The team’s approach to studying the IAT data combined psychological levels of analysis with sociological and political levels of analysis in an attempt to explore how and why psychological dynamics might differ based on region.
“These implicit measures are a psychological tool, and they’re not employed much by the sorts of fields that tend to look at regional differences,” says Packer. “Sociologists and political scientists are much more attuned to looking at national-level data and are interested in how places differ. Psychologists tend to just do things in their lab and assume that if I see it [where I am], it’s universal and people around the country would respond this way.”
Instead, the team looked at the data—and the larger problem—from different angles.
The South, says Packer, has a different history with regard to race relations than the rest of the country. This might explain its results.
“I think what we’re finding is an indicator that [Southern historical events have] had very long-lasting effects, not just politically and economically, but also psychologically. When you look at these very rapid reaction time measures—we’re talking about a few hundred milliseconds responding to black and white faces—you’re seeing differences. Those differences come out of a long history of segregation and repression and racial dominance on the part of the white population. That’s a broader approach than psychologists have tended to take.”
The group’s findings may have policy implications as well. Regional variations and different underlying dynamics might indicate the need for localized approaches to addressing bias, rather than a one-size-fits-all-states approach.
Packer says there’s still much more work to be done.
“To me the process this summer is like scientific investigation always is, especially in the beginning: the more you find out, the more questions you’re raising. We are seeing very consistent patterns whether we’re comparing states to each other, whether we’re comparing counties to each other, and that’s reassuring—there’s really something there. We have hypotheses about what they might mean or where they come from, but that’s still a big question. Is that really what’s going on? It makes sense, but I think it has, at least for me, raised a whole series of related questions that follow from this that we’re going to have to get into.”
If this story interests you, please click here to learn about Lehigh's new Data X initiative, which focuses on strengthening Lehigh's research and teaching capacity in computer and data science across multiple disciplines.
Posted on:


